 ChatGPT
 Grok
Grok
 Perplexity AI

4 min read | By Postpublisher P | 05 February 2024 |
The importance of data graphics has emerged as a game-changer in the world of social media. It is a place where attention is a valuable commodity and user interactions are the currency of success. As people read a lot of information, using smart visuals can captivate, inform, and engage them. This trip shows how pictures can increase social media engagement through data graphics. Data visualisations are powerful storytellers. They simplify complex information and connect with diverse audiences.
In this investigation, we will look at the popular data representations on social media. The tools include simple visuals and interactive features to engage users directly. It will reveal the techniques for producing attention-grabbing images that tell a story and leave a lasting effect on viewers. When using analytics and metrics, we need to see if data graphics work well in social media. We will also talk about intangible things. These are the discussions and relationships created with digital images.
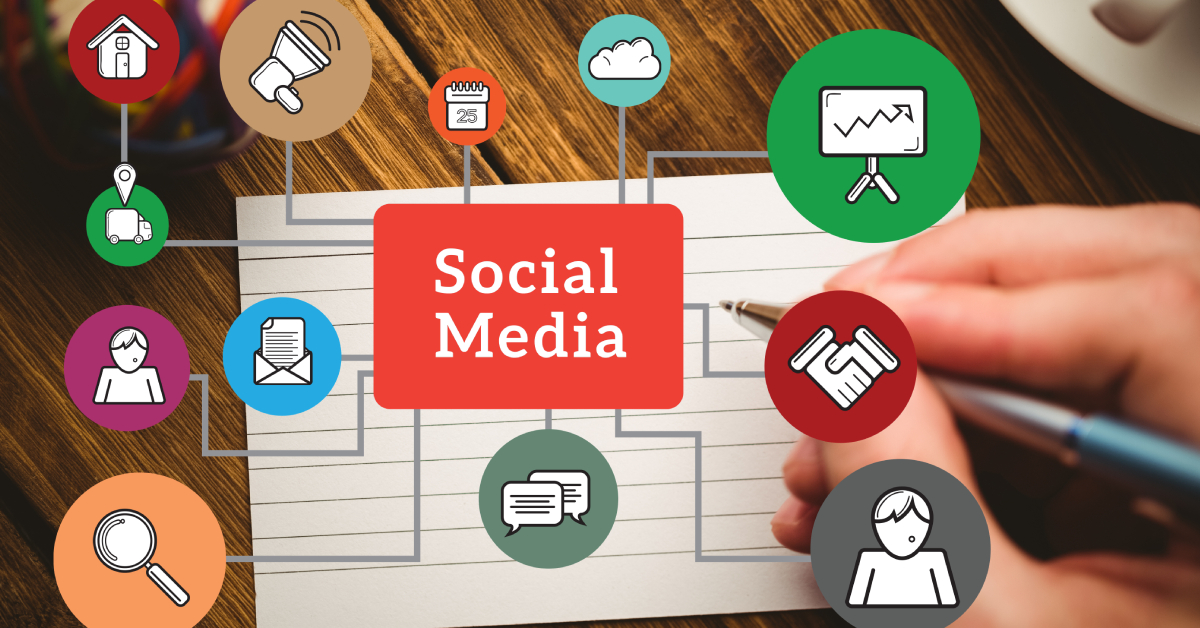
Visual material in social media platforms has become essential for efficient communication. Users are more inclined to interact with and share visual material than text-only posts. The use of data visualisations expands this. It offers a dynamic and educational method of presenting complicated information.
There has been a visual revolution on social media sites. We’ve gone from the early days of text-based updates to a time when photographs, videos, and interactive material were the norm. Data graphics become a potent tool for telling tales, delivering information, and generating deep engagement in this visually focused world.
● Visuals Simplify Complexity: Data graphics are naturally good at making complicated information simpler. Visuals give information in an easy-to-read style that is more approachable and less daunting for the audience. It can be complex data, study findings, or market trends.
● Increased Shareability: Text takes longer for the human brain to process than images. The greater shareability of visual material is due to this feature. Data graphics are an excellent choice for social media sharing. It is so because users are more inclined to share material that they can grasp and find visually appealing.
● Memorability and Impact: Images naturally stick in the mind more than text does. Making your key points more memorable may be achieved by using data visualisations into your social media strategy. How memorable your content is affects how much of an impact it will have later on.

● Infographics: Infographics are the data visualisation’s superheroes. They mix text, symbols, and pictures to provide information in a visually appealing and structured manner. Ideal for compressing complicated data into a shareable format.
● Charts and Graphs: Charts and graphs are good for conveying numerical data since they are simple yet powerful. Select the best format for your message: a bar chart showing growth over time or a pie chart with percentages.
● Interactive Visuals: Use the interactive features of social media platforms such as Twitter, Instagram, and LinkedIn. Create polls, quizzes, or interactive maps to promote user interaction. When consumers feel personally involved, their engagement levels rise.
● Data-Driven Videos: Video content continues to rule social media. Incorporate data graphics to improve your video approach. To make your videos more interesting, include visuals like animated charts, dynamic graphs, or statistical overlays.
● Clarity and Simplicity: Clarity is the first and most important data visualization guideline. Keep extra details to a minimum. Maintain simplicity and concentrate on delivering a single vital point.
● Audience Relevance: Tailor your data visualizations to your target audience. Learn about their interests, tastes, and the kinds of information they value. The key to grabbing and sustaining attention is relevance.
● Consistent Branding: Maintain a consistent visual identity across your data visualizations. Colors, typefaces, and logos should be used consistently to establish your brand and make your material readily recognized.
● Mobile-Friendly Design: Many social media users access platforms through mobile devices. Ensure your data visualizations are mobile-friendly, with clear text and correctly sized pictures.
● Storytelling Method: Convert your data into a narrative. Create a narrative around your visual pieces, directing your viewers through the material. A narrative method not only teaches but also entertains.
Understanding the impact of data graphics goes hand in hand with effectively using them. Social media networks have powerful analytics tools that provide information into the performance of your content. Keep track of data like likes, shares, comments, and click-through rates. Determine which sorts of graphics are most appealing to your audience and change your strategy appropriately.
Encourage direct involvement in addition to analytics. Invite your audience to comment on your data visualizations, take surveys, or join in discussions prompted by your content. Engaging your audience fosters a sense of belonging and loyalty.
Using data graphics in social media is a smart strategy to capture and engage audiences. Here, algorithms develop, and trends come and go. Using data graphics in your social media strategy can help marketers, content producers, and company owners. It boosts online visibility, strengthens connections, and sets you apart in a busy online environment.
As you go on this visual adventure, remember that each data graphic should have a purpose – to inform, inspire, or entertain. Data and graphics can make your social media channels engaging and interactive places. Accept the power of data visualization, and watch as your social media presence gains a new level of impact and influence.
Join over 150,000+ subscribers who get our best digital insights, strategies and tips delivered straight to their inbox.